


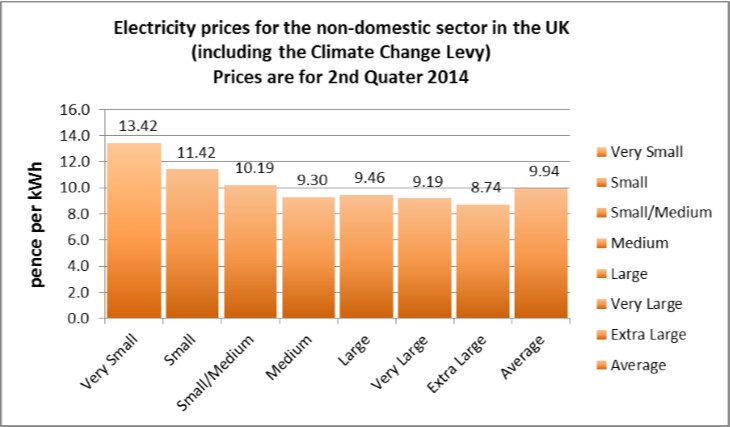
Our graphs below show the average gas and electricity prices paid in the 2nd Quarter of 2014 for non-domestic consumers based on their consumption. Do these prices match with what you are paying?
Graph 1 – average electricity prices for the 2nd quarter of 2014, banded according to size of consumption.
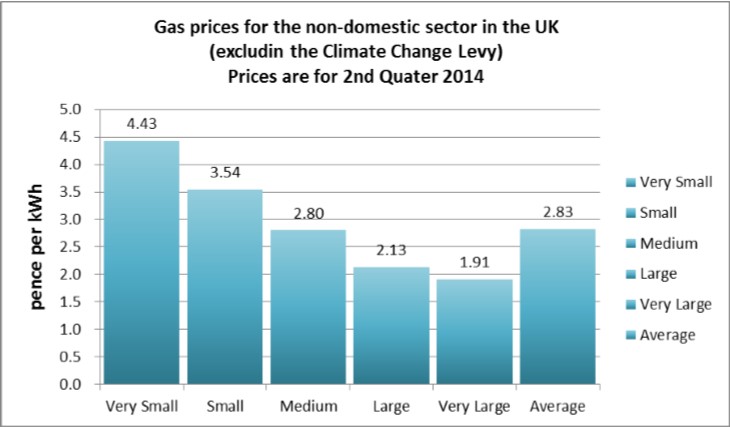
Graph 2 – average gas prices for the 2nd quarter of 2014, banded according to size of consumption
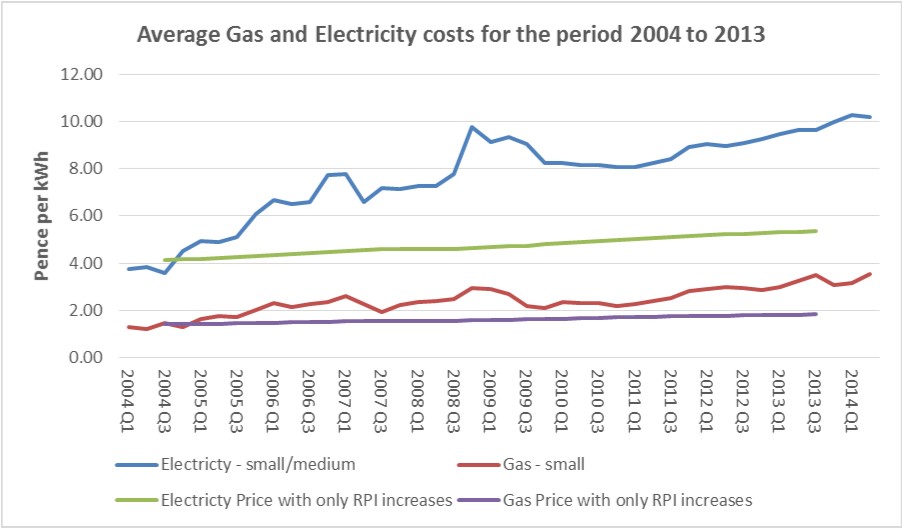
Graph 3 depicts the trends in average electricity and gas prices for a typical Small/ Medium electricity consumer and a Small gas consumer. Over the last 11 years, electricity prices have risen by 260% (181% more than RPI) and gas by 269% (191% more than RPI).
This is clear evidence that finding and negotiating a better deal can give drastic results.
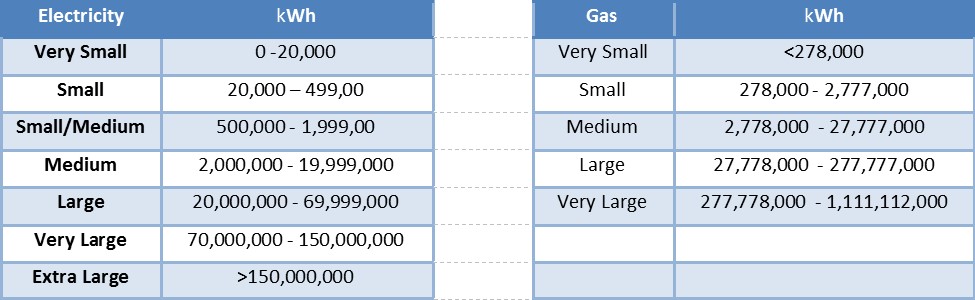
The categories used above e.g. ‘Small’ and ‘Small/Medium’ are defined below. Source of information DECC.